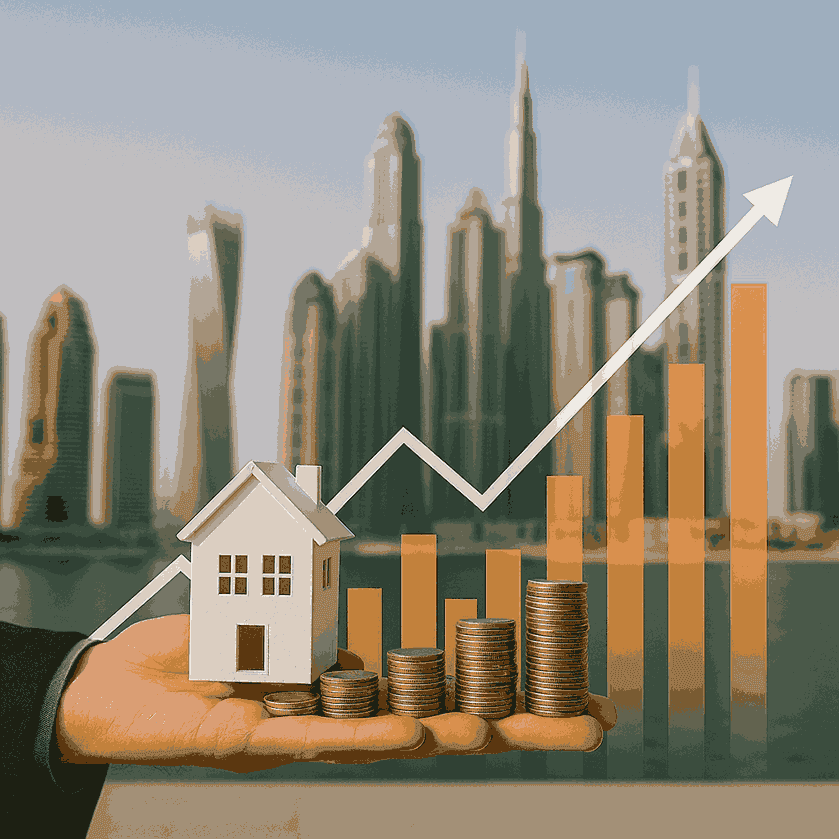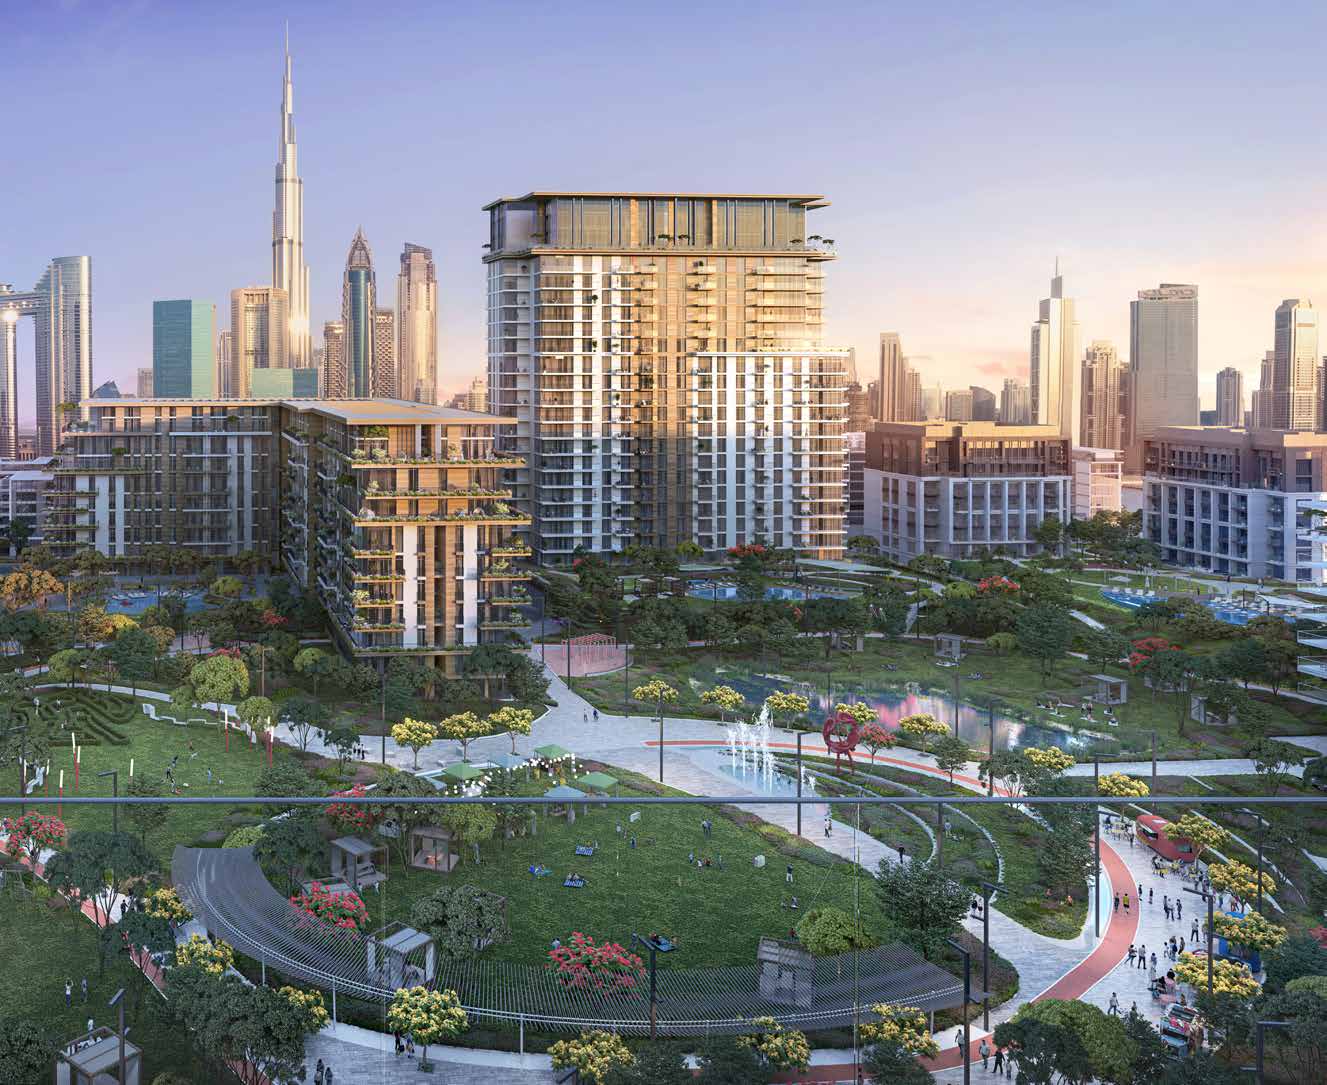


Dubai recorded 13,872 property sales worth AED 34.5 billion in July 2026. Although transaction volume declined by 4% from June, total sales value increased by 3.9%, while the reported market price remained broadly stable at AED 1,680 per square foot.
The figures do not point to a market-wide collapse. Instead, July reflected a more selective and value-driven property market in which fewer transactions generated more capital than in the previous month.
Dubai Property Market July 2026 at a Glance
| Market Indicator | July 2026 Result | Month-on-Month | Year-on-Year |
|---|---|---|---|
| Property sales volume | 13,872 transactions | -4.0% | -31.6% |
| Total sales value | AED 34.5 billion | +3.9% | -46.9% |
| Reported price per sq. ft. | AED 1,680 | +0.2% | -1.2% |
| Estimated value per transaction | AED 2.49 million | Approximately +8.2% | Not calculated |
The most important story is not simply that transaction volume declined. It is that sales value increased despite fewer properties being sold.
Based on the rounded market totals, the estimated value per transaction reached approximately AED 2.49 million. The implied average deal value was around 8.2% higher than in June.
This suggests that larger or more valuable property transactions had a greater influence on Dubai’s market performance during July.
Did Dubai’s Real Estate Market Grow or Slow Down in July 2026?
Dubai’s property market slowed by transaction count but grew by monthly sales value.
The number of transactions declined by 4% from June, while total sales value increased by 3.9%. At the same time, the reported price per square foot moved only 0.2% higher.
July cannot accurately be described as either a broad market surge or a broad market decline. It was better characterised as a month of market normalisation and transaction-mix adjustment.
- Fewer properties changed hands.
- The properties sold carried a higher estimated average value.
- Prices remained broadly stable month-on-month.
- Buyers appeared more selective.
- Higher-ticket land and villa transactions supported total market value.
This type of movement is common in a maturing market. Transaction volume, prices and sales value do not always rise or fall together. Investors should therefore consider where Dubai currently sits within the wider real estate market cycle, rather than relying on a single headline figure.
Why Did Sales Value Increase While Transaction Volume Fell?
The answer can be found in the types of properties sold. Apartments dominated transaction volume, but plots and villas contributed a much larger proportion of sales value relative to their transaction numbers.
| Property Type | Transactions | Sales Value | Approx. Share of Volume | Approx. Share of Value |
|---|---|---|---|---|
| Apartments | 11,759 | AED 17.8B | 84.8% | 51.6% |
| Villas | 1,322 | AED 7.8B | 9.5% | 22.6% |
| Commercial properties | 515 | AED 1.9B | 3.7% | 5.5% |
| Plots | 268 | AED 6.9B | 1.9% | 20.0% |
Plots represented less than 2% of the reported transaction volume but generated around one-fifth of the market’s total sales value. This disproportionate contribution helps explain how total sales value increased while the number of transactions declined.
Estimated Value Per Transaction by Property Type
| Property Type | Estimated Value Per Transaction |
|---|---|
| Apartment | AED 1.51 million |
| Villa | AED 5.90 million |
| Commercial property | AED 3.69 million |
| Plot | AED 25.75 million |
These figures are calculated from rounded category totals and should be treated as directional estimates rather than exact median property prices.
How Did Apartments Perform in July 2026?
Apartments remained Dubai’s primary transaction engine, accounting for nearly 85% of all recorded sales.
A total of 11,759 apartments changed hands, generating approximately AED 17.8 billion in sales value.
Apartment volume increased by 0.5% from June but remained 27.6% below the corresponding annual comparison. This shows that apartment activity was relatively stable month-on-month, even though it had not returned to the stronger levels recorded a year earlier.
The apartment segment continued to provide the market with:
- The greatest transaction liquidity
- A broad range of entry prices
- Access to established and developing communities
- Options for both end-users and rental investors
- Greater unit availability than lower-density property categories
High sales volume alone does not guarantee strong investment performance. Investors must still evaluate building quality, service charges, handover schedules, rental demand and competing supply.
What Happened to Dubai Villa Sales?
Dubai recorded 1,322 villa transactions worth AED 7.8 billion during July.
Villa sales volume declined by 13.1% from June and 56.4% from the annual comparison. This was the steepest year-on-year volume decline among the four reported property categories.
Villas still generated approximately 22.6% of total market value despite accounting for only 9.5% of transaction volume. This demonstrates the impact of the segment’s higher average ticket size.
The figures do not necessarily mean that family or luxury housing demand disappeared. Villa buyers may have become more selective because of higher entry prices, limited inventory in preferred communities and differences between newly launched and completed homes.
For broader context, explore Next Level Real Estate’s analysis of Dubai’s villa sales and family-driven property demand .
Did Commercial Property Activity Improve?
Commercial real estate recorded 515 transactions worth AED 1.9 billion.
Transaction volume increased by 8% from June but remained 15.2% below its annual comparison. This monthly improvement indicates that commercial activity was more resilient in July than several residential categories by transaction count.
Commercial transactions may include a diverse mix of offices, retail units and other income-generating assets. Performance can therefore vary substantially between locations and property classes.
The supplied Q2 2026 market report recorded AED 24.24 billion in commercial transaction value across 2,836 transactions during the quarter. Commercial activity was led by land and offices, highlighting continued investor interest in development assets and income-generating properties.
Why Were Plot Sales Important?
Plots recorded only 268 transactions, but their combined sales value reached approximately AED 6.9 billion.
Transaction volume increased by 16.5% from June, the strongest monthly growth among the reported categories. Plot activity nevertheless remained 32% below the annual comparison.
Their estimated average value of approximately AED 25.75 million per transaction explains why plots had such a significant influence on Dubai’s July sales value.
Strong land activity may reflect:
- Developer acquisitions
- Long-term development strategies
- Demand for custom-built properties
- Expansion into emerging districts
- Confidence in future infrastructure and population growth
The dataset does not reveal the purpose of every plot transaction. The figures should therefore not be interpreted as proof that all land was purchased for immediate development.
What Was the Property Price Per Square Foot in July 2026?
The overall dashboard reported a market price of AED 1,680 per square foot, representing:
- A 0.2% increase from June
- A 1.2% decline from the annual comparison
This suggests that overall pricing remained broadly stable during the month.
Primary Market Price Overview
| Primary-Market Property Type | Median Price Per Sq. Ft. | Change vs. 2025 | Change vs. 2014 |
|---|---|---|---|
| Apartment | AED 1,724 | -5.6% | +63.8% |
| Plot | AED 540 | +26.6% | +44.8% |
| Villa | AED 1,248 | -27.9% | +41.2% |
Shorter-term comparisons show uneven performance among property types, while the comparison with 2014 indicates that all three primary-market categories remained above their longer-term reference levels.
Plot pricing was the only category showing an increase against the 2025 comparison, rising by 26.6%. Apartments and villas recorded declines of 5.6% and 27.9%, respectively.
Investors should avoid using a citywide price-per-square-foot figure to value an individual property. Building age, developer reputation, floor level, views, community maturity, furnishing, payment status and handover timing can produce significant price differences.
How Did Dubai Rental Prices Perform in July?
Rental movements varied across apartments, villas and commercial properties.
| Rental Category | Reported Annual Rent | Change from June 2026 |
|---|---|---|
| Apartment | AED 65,900 | +4.6% |
| Villa | AED 175,000 | -5.4% |
| Commercial | AED 58,700 | Not reported due to source anomaly |
Apartment rents increased by 4.6% from June, suggesting continued tenant demand across the apartment market.
Villa rents declined by 5.4%. This could reflect monthly changes in the type, size and location of villas registered rather than a uniform reduction across every villa community.
The supplied dashboard displayed an anomalous monthly percentage for commercial rent. That percentage has therefore been excluded rather than presented as a genuine market movement.
Responsible market analysis should remove unreliable values instead of repeating them simply to create a stronger headline.
Which Areas Recorded the Most Sales in July 2026?
The top five areas by July transaction volume were:
- Dubai South
- Al Barsha South Fourth
- Jebel Ali
- Wadi Al Safa 4
- Jabal Ali First
Dubai South held a considerable lead over the remaining locations on the supplied chart.
Its performance may have been supported by available inventory, large-scale master planning, relative affordability and long-term infrastructure expectations.
Investors interested in this part of the city can explore how the Al Maktoum International Airport expansion may affect Dubai South real estate .
July’s ranking should not automatically be treated as a permanent market league table. Monthly results can be affected by project releases, bulk registrations, handover activity and transaction-recording dates.
Which Dubai Areas Generated the Highest Sales Value?
The top five locations by sales value were:
- Wadi Al Safa 4
- Dubai South
- Me’Aisem First
- Jabal Ali First
- Business Bay
Wadi Al Safa 4 ranked first by value despite placing fourth by transaction volume. This suggests that its July activity included properties with comparatively higher transaction values.
Dubai South was the only location occupying a top-two position for both value and volume, indicating a combination of liquidity and capital deployment.
Business Bay ranked among the leading locations by value but not volume. This is an important reminder that premium or centrally located markets can generate substantial capital through fewer transactions.
Readers considering this location can review the detailed Business Bay real estate investment guide for wider community and investment context.
Where Was Dubai Property Demand Strongest Over the Last 12 Months?
July’s figures provide a one-month snapshot. The supplied Bayut data provides a broader view of sale transactions recorded across Dubai during the previous 12 months.
| Rank | Dubai Community | Sale Transactions |
|---|---|---|
| 1 | Dubai Investments Park | 7,327 |
| 2 | Majan | 6,131 |
| 3 | Dubai Islands | 5,355 |
| 4 | Jumeirah Village Triangle | 5,067 |
| 5 | Dubai Science Park | 4,695 |
| 6 | Motor City | 4,440 |
| 7 | Dubai Creek Harbour | 4,107 |
| 8 | Dubai Production City | 3,897 |
| 9 | Arjan | 3,861 |
| 10 | Dubai Maritime City | 3,750 |
| 11 | Dubai Sports City | 3,409 |
| 12 | DAMAC Islands 2 | 3,359 |
| 13 | Sheikh Zayed Road | 3,245 |
| 14 | Meydan | 3,215 |
| 15 | Dubai Hills Estate | 3,138 |
| 16 | Al Furjan | 2,894 |
| 17 | Downtown Dubai | 2,855 |
| 18 | Dubai Silicon Oasis | 2,624 |
| 19 | Dubai Marina | 2,584 |
| 20 | DAMAC Lagoons | 2,561 |
The ranking reveals that Dubai’s most active transaction markets were not limited to its traditional prime districts.
Dubai Investments Park, Majan, Jumeirah Village Triangle, Dubai Science Park, Motor City, Dubai Production City and Arjan all recorded more transactions than Downtown Dubai and Dubai Marina.
This does not mean these communities were more valuable or automatically delivered better investment returns. It means they experienced greater transaction activity under the filters applied to the dataset.
Why Are Monthly Leaders Different From the 12-Month Ranking?
Dubai South led July’s transaction-volume ranking, while Dubai Investments Park led the supplied rolling 12-month dataset.
This difference is expected because the two datasets answer different questions.
July’s Ranking Shows Immediate Momentum
A monthly table identifies where transactions were concentrated during a specific period. It can be strongly influenced by:
- New project releases
- Bulk registrations
- Developer campaigns
- Handover activity
- Seasonal buyer behaviour
- Delayed transaction records
The 12-Month Ranking Shows Sustained Liquidity
A rolling annual dataset reduces the influence of one unusually strong or weak month. It provides broader evidence of where buyers remained active over a longer period.
- Monthly strength can reveal current momentum.
- Annual transaction volume can reveal sustained liquidity.
- Sales value can reveal where more capital is being deployed.
- Price and rental performance can show whether demand is translating into stronger returns.
Communities appearing across several indicators may deserve further research, but no area should be selected based on transaction count alone.
Next Level Real Estate’s guide to Dubai’s emerging real estate areas provides additional context for buyers comparing developing communities.
Did Prime Dubai Communities Perform Poorly?
No. Lower transaction volume does not necessarily indicate weak performance.
| Prime Community | 12-Month Transactions |
|---|---|
| Downtown Dubai | 2,855 |
| Dubai Marina | 2,584 |
| Palm Jumeirah | 1,327 |
| Bluewaters Island | 127 |
| Emirates Hills | 25 |
Prime communities generally have higher entry prices and more limited inventory. A small number of luxury sales can therefore produce significant value without generating a high transaction count.
Transaction volume is primarily an indicator of market activity and liquidity. It does not directly measure:
- Capital appreciation
- Rental yield
- Average transaction value
- Supply scarcity
- Property quality
- Long-term investment performance
Value, volume, rental income and property-level fundamentals must therefore be assessed together.
What Does Dubai’s 12-Month Sales Trend Show?
Monthly property sales remained close to 19,000 to 20,000 transactions between August and December 2025. Activity then moderated during the first half of 2026.
| Month | Approximate Transaction Volume |
|---|---|
| August 2025 | 19,000 |
| September 2025 | 20,000 |
| October 2025 | 20,000 |
| November 2025 | 19,000 |
| December 2025 | 19,000 |
| January 2026 | 17,000 |
| February 2026 | 17,000 |
| March 2026 | 13,000 |
| April 2026 | 14,000 |
| May 2026 | 10,000 |
| June 2026 | 14,000 |
| July 2026 | 14,000 |
The chart illustrates three broad phases:
- Elevated transaction levels during the final months of 2025.
- Gradual moderation during early 2026, followed by a low point in May.
- A recovery in June, with July maintaining a similar level.
July therefore appears more like stabilisation after May’s decline than the beginning of a fresh market collapse.
The supplied Q2 2026 report reached a similar broader conclusion. Dubai remained active, but transaction activity had moved to a more measured pace after an exceptionally strong opening quarter.
What Do the July Figures Mean for Property Buyers?
Buyers may benefit from a more selective market, but selection should not be confused with automatic discounts.
Stable monthly pricing and lower transaction volume suggest buyers may have more time to compare:
- Developers
- Payment plans
- Unit positions
- Handover schedules
- Service charges
- Community infrastructure
- Resale competition
A buyer should investigate the exact building or project rather than relying solely on Dubai-wide averages.
For ready properties, recent sales in the same building can provide a better benchmark. For off-plan properties, buyers should compare launch pricing with nearby completed developments and competing future supply.
What Does July Mean for Dubai Property Investors?
The July figures reinforce the importance of asset selection.
Apartments delivered the highest liquidity, while plots and villas contributed greater value per transaction. Neither is automatically the better investment because each serves a different strategy.
Rental-Income Investors May Prioritise
- Existing tenant demand
- Achievable annual rent
- Service charges
- Vacancy risk
- Building management
- Net yield after costs
Capital-Growth Investors May Prioritise
- Infrastructure development
- Supply limitations
- Developer execution
- Payment structure
- Entry price
- Future community maturity
Dubai South’s strong monthly position and the wider 12-month performance of Dubai Islands, Dubai Creek Harbour, Arjan and Dubai Maritime City indicate that developing districts remain important. High activity should still be followed by project-level due diligence.
What Do the Results Mean for Sellers?
Sellers should pay close attention to realistic pricing.
The market continued to generate substantial value, but overall volume remained below the annual comparison. Buyers may therefore be more selective and less willing to overpay for poorly positioned properties.
Properties are more likely to attract serious interest when they are:
- Priced using recent comparable sales
- Professionally presented
- Supported by accurate documentation
- Vacant or easily accessible for viewings
- Clearly differentiated from competing listings
A listing price based on older peak expectations may remain on the market longer, particularly where buyers have multiple comparable options.
Is Dubai’s Property Market Cooling in 2026?
Dubai’s property market was cooler by transaction volume than a year earlier, but the July data does not indicate a uniform price collapse.
Three indicators support this conclusion:
- Sales volume declined by 31.6% year-on-year.
- Sales value increased by 3.9% month-on-month.
- The reported price per square foot changed by only 0.2% from June.
A more accurate description is that Dubai entered a period of normalisation, selective demand and uneven performance across property categories.
Some communities and asset types continued to attract strong capital, while others experienced weaker transaction volumes.
Dubai Real Estate Market Outlook After July 2026
Dubai’s next market phase is likely to be shaped less by citywide momentum and more by differences between individual communities, projects and property types.
Important indicators to monitor during the coming months include:
- Whether transaction volume remains stable after the June recovery
- Whether sales value continues to outperform transaction volume
- The number and pricing of new project launches
- Ready-property resale liquidity
- Upcoming handovers and competing supply
- Apartment and villa rental movements
- Plot acquisitions in developing districts
- Buyer responses to payment plans and financing conditions
July’s results suggest that capital remained active, but it was not distributed evenly.
Areas with strong connectivity, credible master plans, expanding infrastructure and practical lifestyle value may remain more resilient than developments relying primarily on promotional demand.
Final Verdict
Dubai’s real estate market recorded a mixed but resilient performance in July 2026.
Transaction volume declined to 13,872 sales, yet total value increased to AED 34.5 billion. Apartments continued to dominate activity, while villas and plots contributed disproportionately to market value.
Dubai South led monthly transaction volume, while Wadi Al Safa 4 generated the highest sales value. Over a broader 12-month period, Dubai Investments Park, Majan, Dubai Islands, Jumeirah Village Triangle and Dubai Science Park recorded the highest activity in the supplied Bayut dataset.
The evidence does not support describing July as either a property boom or a market crash.
It points to a market that is becoming more selective, more location-sensitive and increasingly influenced by transaction quality rather than volume alone.
For buyers and investors, this creates opportunity, but only when citywide statistics are combined with project-level research, accurate comparisons and a clearly defined investment objective.
Frequently Asked Questions
How many properties were sold in Dubai in July 2026?
Dubai recorded 13,872 property sales during July 2026. Transaction volume declined by 4% from June and 31.6% from the annual comparison.
What was the total value of Dubai property sales in July 2026?
Total Dubai property sales reached approximately AED 34.5 billion. Despite fewer transactions, sales value increased by 3.9% month-on-month.
What was Dubai’s property price per square foot in July 2026?
The overall dashboard reported AED 1,680 per square foot, representing a monthly increase of 0.2% and a 1.2% decline from the annual comparison.
Which property type recorded the most transactions?
Apartments recorded 11,759 sales and accounted for approximately 84.8% of all transactions. They generated AED 17.8 billion in sales value.
Which property type generated the highest estimated value per transaction?
Plots generated the highest estimated value per transaction at approximately AED 25.75 million. This calculation is based on 268 plot transactions worth AED 6.9 billion.
Which area recorded the most transactions in July 2026?
Dubai South ranked first by July transaction volume, followed by Al Barsha South Fourth, Jebel Ali, Wadi Al Safa 4 and Jabal Ali First.
Which area generated the highest sales value?
Wadi Al Safa 4 ranked first by sales value, followed by Dubai South, Me’Aisem First, Jabal Ali First and Business Bay.
Which Dubai community recorded the most transactions over the last 12 months?
According to the supplied Bayut dataset, Dubai Investments Park recorded 7,327 sale transactions, followed by Majan with 6,131 and Dubai Islands with 5,355.
Are Dubai property prices falling?
The supplied July data does not show a broad monthly price decline. The reported market price per square foot increased by 0.2% from June, although it remained 1.2% below its annual comparison.
Is July 2026 a good time to buy property in Dubai?
The answer depends on the property, price and buyer’s objective. Lower transaction volume may create more comparison and negotiation opportunities, but investors should still assess comparable sales, rental income, service charges, future supply and developer quality.