

Explore Off-Plan Projects
Stay in the loop Through our newsletter
Get to know about the latest real estate insights.

Next Level © 2026 All Right Reserved
Stay in the loop Through our newsletter
Get to know about the latest real estate insights.
Next Level © 2026 All Right Reserved
Dubai Islands recorded 3,558 property sales between 1 January and 30 September 2026, in the research snapshot accompanying this report, attributed to Dubai Land Department (DLD) records via DXBinteract. That is 19.2% more than the 2,985 sales registered in the same nine months of 2025, and it already equals 80% of the area's full-year 2025 total of 4,456 deals. The quarterly and monthly counts below refer to the same January–September window. The project leaderboard uses a later, explicitly labelled October cut-off.
This report separates transaction activity from investment conclusions. Read the quarterly comparison, check the unit mix, then use the purchase checklist to assess a specific property. The main tables retain the supplied research snapshot; its verification limits are stated in the methodology.
| Metric (1 Jan to 30 Sep 2026) | Figure | Context |
|---|---|---|
| Total sales registered | 3,558 | +19.2% vs 2,985 in 9M 2025 |
| Sales value, H1 2026 | AED 10.86 billion | Q1 AED 5.60bn, Q2 AED 5.26bn |
| Primary apartment value, Q3 2026 | AED 1.45 billion | Primary apartments only; not total Q3 sales value |
| Median price per sq ft, research snapshot | AED 2,829 | AED 2,397 in 2025, AED 1,922 in 2024 |
| Primary share of unit sales | 97.3% | 3,446 primary and 97 resale unit sales |
| Most traded unit type | 1 bedroom apartments | 1,634 sales, 46% of total |
| Leading development in October YTD snapshot | Hado by Beyond | 627 sales across three towers |
| Announced pipeline in research snapshot | 13,734 units | Across 94 announced projects |
Source attribution: accompanying Content Intelligence Report, dated 20 October 2026, citing DLD data via DXBinteract. These are fixed research figures, not a live transaction feed. See methodology for scope and verification limits.
The nine month total hides a very uneven year. The table below shows registered sales and median price per square foot for each quarter, alongside the same quarter of 2025.
| Quarter | Sales 2026 | Sales 2025 | Change | Median AED per sq ft 2026 |
|---|---|---|---|---|
| Q1 (Jan to Mar) | 1,699 | 728 | +133% | 2,770 |
| Q2 (Apr to Jun) | 1,377 | 1,268 | +9% | 3,040 |
| Q3 (Jul to Sep) | 482 | 989 | -51% | 2,550 |
| 9 months | 3,558 | 2,985 | +19% |
Within the nine-month snapshot, Q1 had the most registrations and Q2 the highest quarterly median price per square foot. Q3 volume was 65.0% below Q2 and 51.3% below Q3 2025. Those changes describe recorded activity; they do not isolate the cause of the slowdown or the value of an individual home.
| Month | Sales registered | Median AED per sq ft |
|---|---|---|
| January | 655 | 2,705 |
| February | 623 | 2,832 |
| March | 421 | 2,783 |
| April | 733 | 3,029 |
| May | 370 | 3,055 |
| June | 274 | 2,932 |
| July | 200 | 2,629 |
| August | 131 | 2,504 |
| September | 151 | 2,575 |
April 2026 was the single busiest month, with 733 registrations. The spike coincided with the launch of The Meriva Collection by Ellington on Island B, whose 932 unit first phase was one of the largest residential launches anywhere in Dubai that quarter. January and February were lifted by continued registrations from Hado by Beyond and Ellington Sands, both launched in the final quarter of 2025.
Buyer takeaway: a launch can produce a cluster of registrations, so compare several months before judging demand. A quiet month alone does not prove either weak demand or an absence of new supply.
Dubai Islands, formerly known as Deira Islands and before that Palm Deira, is a five island masterplan developed by Nakheel, now part of Dubai Holding Real Estate. Key facts from Nakheel's 2022 masterplan announcement and Dubai Holding's April 2026 update:
Two infrastructure milestones in 2026 strengthened the investment case. On 20 April 2026, Nakheel awarded a AED 527 million contract to Al Nasr Contracting Company for primary infrastructure on Island B, covering roads, potable water, power, telecoms, drainage and district cooling integration. Separately, the Roads and Transport Authority is delivering a 1,425 metre bridge from Bur Dubai across Dubai Creek to Dubai Islands, with four lanes in each direction and capacity for 16,000 vehicles per hour, as part of the AED 5.3 billion Al Shindagha Corridor programme.
For buyers, the location proposition is simple: beachfront living at a lower price per square foot than Palm Jumeirah, with access to the airport and the old city, with a hospitality pipeline that supports short term rental demand. Branded hospitality is already arriving, led by projects such as the Rixos branded residences launched by Nakheel.
| Unit type | Sales, Jan to Sep 2026 | Share of sales | Median sale price (AED) | Typical size (sq ft) |
|---|---|---|---|---|
| Studio | 41 | 1.2% | 1,175,500 | 313 to 533 |
| 1 bedroom | 1,634 | 46.1% | 2,418,830 | 638 to 1,133 |
| 2 bedroom | 1,368 | 38.6% | 3,615,330 | 989 to 1,910 |
| 3 bedroom | 421 | 11.9% | 5,917,830 | 1,373 to 3,832 |
| 4 bedroom | 71 | 2.0% | 9,450,000 | 1,972 to 7,138 |
| 5 bedroom | 8 | 0.2% | 16,578,000 | 3,553 to 7,592 |
Source: DLD records via DXBinteract. Shares are calculated on the 3,543 residential and commercial unit sales with a recorded bedroom count; the remaining 15 transactions in the 3,558 total were plots.
One and two bedroom apartments made up 85% of everything sold. That mix is typical of a young off-plan market where investors dominate and most launches are mid-rise beachfront apartment buildings. It also tells you where resale competition will be heaviest at handover.
The research snapshot classifies 3,446 of 3,543 unit sales as primary purchases and 97 as resales: 97.3% and 2.7% respectively. Primary means bought from a developer; off-plan means under construction. A resale can also be off-plan. The primary split alone therefore cannot establish a 97% off-plan share. For a project such as Bay Grove Residences by Nakheel, compare its construction status and its sales channel separately.
Villas remain a small but high value slice of the market. Just 35 villa transactions were recorded in the nine months, with median prices of AED 5.8 million for three bedrooms, AED 9.32 million for four bedrooms and AED 16.58 million for five bedrooms. The largest villa deal in the dataset was a 7,138 square foot four bedroom unit in Bay Villas by Nakheel at AED 10.53 million in January 2026, a transaction whose area basis must be checked before comparing it with apartment prices. At the top of the apartment segment, boutique projects such as Cheval Residences and Villa Del Garda Residences are transacting at AED 4,000 to 4,200 per square foot, Browse two bedroom penthouses for sale in Dubai Islands separately: their terrace areas, layouts and views can make area-wide apartment medians misleading.
| Rank | Project (tower) | Developer | Sales YTD to 20 Oct 2026 | Median price (AED) | AED per sq ft |
|---|---|---|---|---|---|
| 1 | Meriva Sunset | Ellington | 245 | 3,249,828 | 3,402 |
| 2 | Hado by Beyond Tower A | Beyond | 228 | 2,653,000 | 3,081 |
| 3 | Hado by Beyond Tower C | Beyond | 217 | 2,702,000 | 3,119 |
| 4 | Ellington Sands I Tower A | Ellington | 215 | 3,064,828 | 2,770 |
| 5 | Ellington Sands II Tower A | Ellington | 187 | 3,116,828 | 2,842 |
| 6 | Hado by Beyond Tower B | Beyond | 182 | 3,638,000 | 3,497 |
| 7 | Liv Oceanside | LIV Developers | 109 | 3,959,548 | 3,161 |
| 8 | Meriva Gardens B | Ellington | 104 | 4,377,328 | 3,480 |
| 9 | Sunset Bay Grand | Imtiaz | 83 | 2,399,240 | 2,315 |
| 10 | Meriva Gardens A | Ellington | 75 | 4,170,828 | 3,420 |
Source attribution: accompanying research report, citing the DXBinteract leaderboard as of 20 October 2026. This table includes October activity and must not be read as a January–September ranking.
Grouped by development, the 2026 leaderboard is dominated by two private developers:
Project registrations and developer release dates are different events. Nakheel announced Bay Estate on 5 October 2026; it should not be presented as a confirmed Q3 public launch. Compare current developer inventory with registered transactions rather than treating an absorption percentage as proof of availability.
The snapshot records 482 sales in Q3, down from 1,377 in Q2 and 989 a year earlier. Launch timing, registration delays, summer trading patterns and changes in buyer demand are possible explanations. The figures alone do not establish how much each contributed.
A lower quarterly median can also reflect a different mix of units and projects. It is not a like-for-like price index. Buyers should compare the same building, bedroom count, size, view and payment status before concluding that a specific property has become cheaper.
Based on 2026 medians, realistic budgets are AED 1.2 million for a studio, AED 2.4 million for a one bedroom, AED 3.6 million for a two bedroom and AED 5.9 million for a three bedroom apartment. On a per square foot basis, Imtiaz launches such as Sunset Bay Grand and Seacliff have traded 15% to 20% below the area median, Hado by Beyond and The Meriva Collection 10% to 25% above it, and boutique projects such as Cheval Residences and Villa Del Garda up to 50% above it.
DLD’s investor service describes a 10-year renewable residence application for qualifying property ownership with a purchase value of at least AED 2 million. Crossing a price threshold is not automatic visa approval. Confirm the documents and the eligibility of the specific property, ownership structure, financing and completion status with DLD before paying a deposit. Read our Golden Visa property guide alongside the official DLD investor service.

Do not turn an area-wide sale median and a separate rental median into an investment yield. They may describe different properties. Obtain comparable signed leases for the same building and unit type, then allow for service charges, vacancy, management, maintenance and furnishing. For holiday homes, check the applicable permissions and building rules, and model occupancy and operating costs rather than assuming year-round tourist demand.
A popular project is not automatically the best purchase for your budget. Use the same evidence standard for a new release and a resale.
| Check | Evidence to request | Why it changes the decision |
|---|---|---|
| Comparable sale | Recent registered deals in the same tower, with matching bedroom count, floor range and view | A community median cannot price a particular unit |
| Area basis | Contracted area, internal layout and balcony or terrace breakdown | A lower price per square foot can conceal less usable indoor space |
| Cash required | Reservation amount, scheduled instalments, transfer and registration charges, agency costs and financing costs | Headline price is not the full cash commitment |
| Delivery risk | Current RERA project record, inspection progress, escrow details and contractual completion terms | A marketing date and a registered completion date can differ |
| Resale obligations | Paid instalments, unpaid balance, developer NOC conditions and transfer requirements | An apparent discount may come with an immediate cash call |
| Rental case | Comparable signed leases, service-charge budget and management quotation | Gross rent can overstate spendable income |
| Exit plan | Competing listings and the next instalment dates | Area sales volume does not guarantee a quick sale of your unit |
For an illustrative AED 2.4 million apartment, write down the cash due now and at each future instalment. Add the transaction charges applicable to your purchase, any mortgage costs, furnishing and an emergency reserve. Do not assume a percentage fee is included in a developer advertisement unless the contract confirms it.
For a rental comparison, use: annual net income = rent collected − vacancy losses − service charges − management and maintenance costs. Divide that result by your total acquisition cost for a simple net-yield estimate before financing and tax. Run a second case with lower rent or a longer vacancy. These are planning scenarios, not rental promises.
Primary references: DXBinteract Dubai Islands transaction dashboard, Nakheel Dubai Islands masterplan and the official DLD investor service linked above.
The supplied research snapshot reports 3,558 property sales in Dubai Islands between 1 January and 30 September 2026, attributed to DLD records via DXBinteract. That is 19.2% more than the 2,985 sales recorded in the same period of 2025.
No. The supplied H1 values and Q3 primary-apartment figure do not have identical property and seller-channel coverage. An exact nine-month value needs a consistent query across the whole period.
The median sale price in Dubai Islands was approximately AED 2,830 per square foot for 2026 to date, compared with AED 2,397 for the whole of 2025. Quarterly medians were AED 2,770 in Q1, AED 3,040 in Q2 and AED 2,550 in Q3 2026.
Hado by Beyond sold the most units of any single development in 2026, with 627 sales across Towers A, B and C. Meriva Sunset, part of The Meriva Collection by Ellington, was the single best selling tower with 245 sales after its April 2026 launch.
No. The snapshot reports 3,446 primary and 97 resale unit transactions, but seller channel and construction status are separate classifications. An off-plan home can be resold, and a developer can sell a completed property.
The research snapshot shows fewer registrations, but cannot establish the causes. Launch schedules, registration timing, seasonality and demand changes may all contribute. Compare matched properties before treating a lower median as a price decline for an individual home.
The median price of a one bedroom apartment sold in Dubai Islands between January and September 2026 was AED 2,418,830, with typical sizes of 638 to 1,133 square feet. One bedroom units were the most traded property type, making up 46% of all sales.
A qualifying purchase may support an application under DLD’s investor service, which specifies a purchase value of at least AED 2 million. Approval is not automatic; confirm the individual property, ownership and documentation requirements with DLD.
The supplied snapshot reports 3,558 sales in January–September 2026, up 19.2% on its matching 2025 figure. The practical question is whether a specific property offers a sensible combination of price, usable space, payment obligations, delivery evidence and holding costs. A busy project ranking or a quieter quarter cannot answer that on its own.
If you are weighing a purchase on Dubai Islands, Next Level Real Estate can show you live DLD comparables for any tower, current developer payment plans and verified resale inventory from earlier launches. Contact our Dubai Islands specialists for a project by project comparison before you commit.

Get the latest property updates.
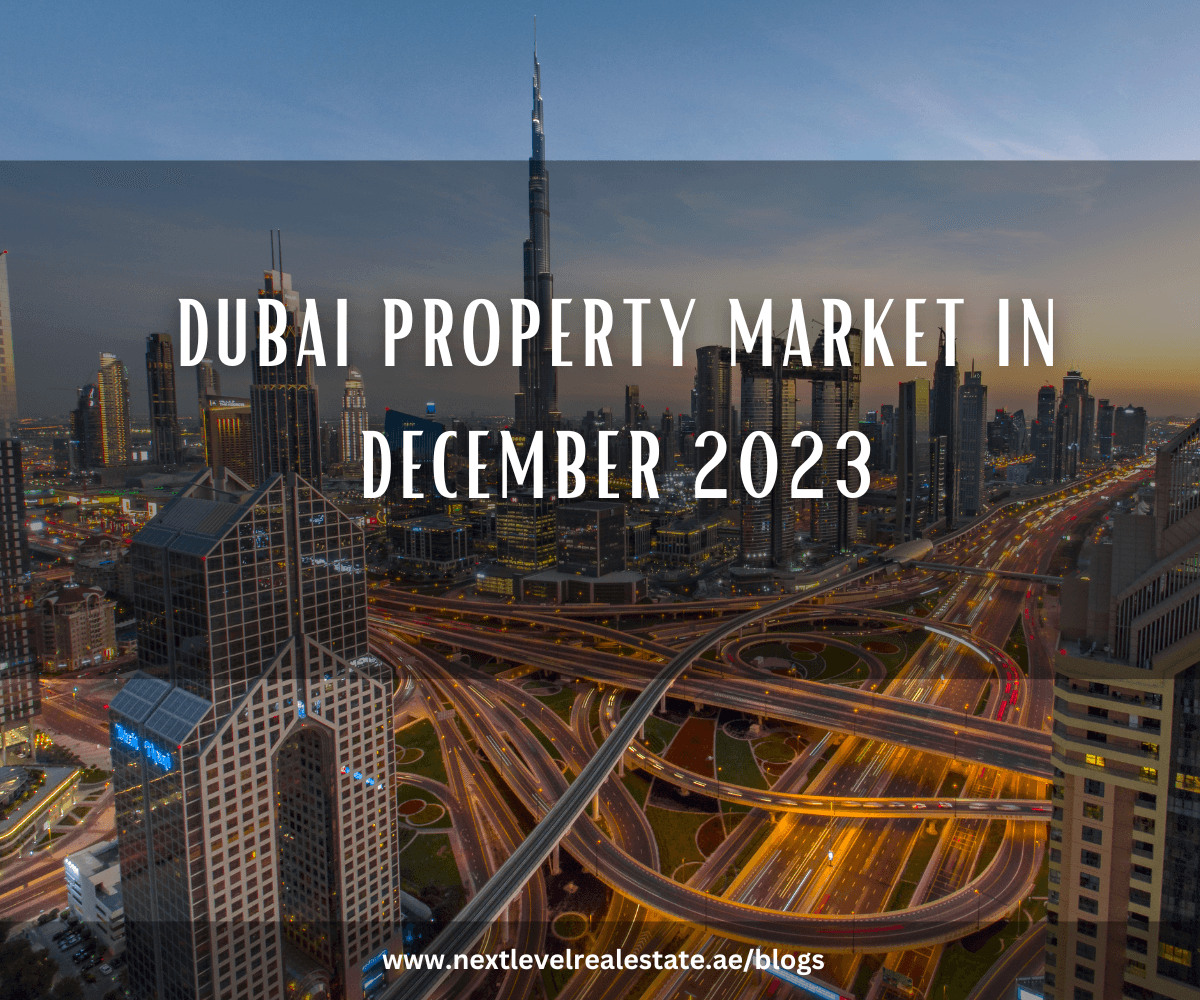
The Dubai property market maintained its buoyant trajectory in December 2023, recording a total of 11,287 property sale transactions, underlined by an impressive total sales val
2024-01-02
Continue Reading
The Dubai real estate market has seen explosive growth in the past decade and is now one of the most vibrant and sought-after markets in the world. The market has seen a steady
2023-02-21
Continue Reading
In April 2024, Dubai's real estate market showcased an impressive performance, marked by a significant surge in sales transactions and a robust uptick in property prices. This s
2024-05-10
Continue Reading
Dubai's real estate market continued to perform strongly in October 2023, with sales transactions and prices rising across all asset classes. According to data from the Dubai La
2023-11-21
Continue Reading
June 2024 proved to be a standout month for Dubai’s real estate market, with record-breaking transactions and rising property values. Discover key insights, leading area
2024-07-15
Continue Reading